Advanced Drawing Tools — Drafting Orbit logo Coming to the Bookmap Marketplace

DRAW · REVIEW · REFLECT

Advanced Drawing Tools (ADT) is a drawing and annotation add-on for Bookmap. Pick from 26 drawing tools and arrange the palette the way you work, with layers to keep a busy chart readable.

It also keeps a per-day journal. Share drawings directly with a secure code, or start a Live Room: traders using ADT see the room on their Bookmap chart, while anyone else can follow a delayed browser view.

draw it · keep it · show it · look back at it

Developed and tested on Bookmap 7.7.0 Drawing and annotation only Never routes orders

Start simple. Turn on the rest when you want it.

ADT has two interface modes. Both carry the same tools and the same settings. What changes is how much of the organizing machinery is on screen.

Where to begin

Essential

Drawing tools and the core object list. The objects window carries Objects and Review. Nothing is lost by starting here.

Everything on

Advanced

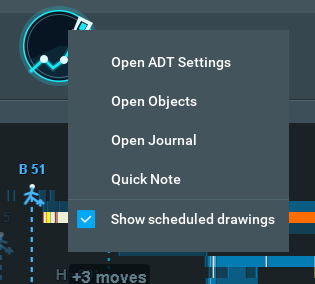
Adds Layers and Storyboard to the objects window, and turns on Quick Annotations. The switch is in Settings, under General.

Four layouts. Pick one.

The palette is a window you move where you want it, and it remembers where you put it. A new install opens on the HUD, so the chart is visible from the start. Switch layouts whenever you like.

Every caption shown

Expanded

Every tool in a wide strip with its caption showing, so nothing has to be recognized from an icon alone.

Tighter

Minimal

The same strip reduced to the icons, for when you already know them by their icons.

The original

Legacy

A tall column with the tools grouped by kind, and the style controls at the foot.

Where you start

HUD

One frameless strip of icons, out of the way, for when you want the chart back.

The palette in the Expanded layout: one wide strip of tool buttons, each with its caption, above the color presets, opacity slider and text size controls.
Expanded — every tool with its caption
The palette in the HUD layout: a single frameless strip of tool icons with the color presets, opacity slider, text size and layer buttons beneath.
HUD — the whole palette as one frameless strip
The palette in the Legacy layout: a tall single column with the tools grouped under Lines, Shapes, Angled, Fib and Move, Arrows, Measurers, Zones, Notes and Delete, with the style controls at the foot.
Legacy — a tall grouped column

The palette bends to how you work.

Drag tools into the order you want and hide the ones you never use. The text-size buttons scale it to your screen, and a badge on the header counts what is on the chart, so 247 objects is never a surprise.

26 tools. Show the ones you use.

Show the drawing tools you actually use, hide the rest, and drag them into the order that suits you. These are all 26 in their default order, shown with the same glyphs and their full names.

Horizontal Line
Vertical Line
Ray
Rectangle
Range Volume Profile
Ellipse
Trend Line
Polyline
Arrow Line
Arc
Channel
Fibonacci
Measured Move
Arrow Up
Arrow Down
Price Range
Long Position
Short Position
Buyers Zone
Sellers Zone
Consolidation Bracket (Buy)
Consolidation Bracket (Sell)
Text Label
Note
Comment
Numbered Callout
One click

Levels and zones

Horizontal and vertical lines, rays, and Buyers and Sellers zones land at the price you click. Consolidation brackets open to the right with a movable HVN line.

Two and three clicks

Lines, curves and swings

Trend Line, Arrow Line and Fibonacci use two clicks. Arc, Channel and Measured Move use three. Polyline keeps accepting anchors until Enter. Hold Shift while placing an Ellipse to constrain it to a circle.

Measurers

Positions and Price Range

Long Position and Short Position place a complete position template at the entry. Price Range reads out a price span, while Measured Move projects a leg forward.

Saying why

Notes and callouts

Text Labels and Notes stay where you mark them. Comments use an aimed leader, while Numbered Callouts connect a numbered bubble to its chart anchor.

Every line can be solid, dashed or dotted. Fibonacci ships with the standard levels and you can edit them. Angled tools can raise an alarm when price crosses them.

The palette with the style row open, showing the color, width, text size, fill percentage, fill toggle, line style and text background controls.
The style row — color, width, fill and line style for whatever you draw next

Box a range. See where it traded.

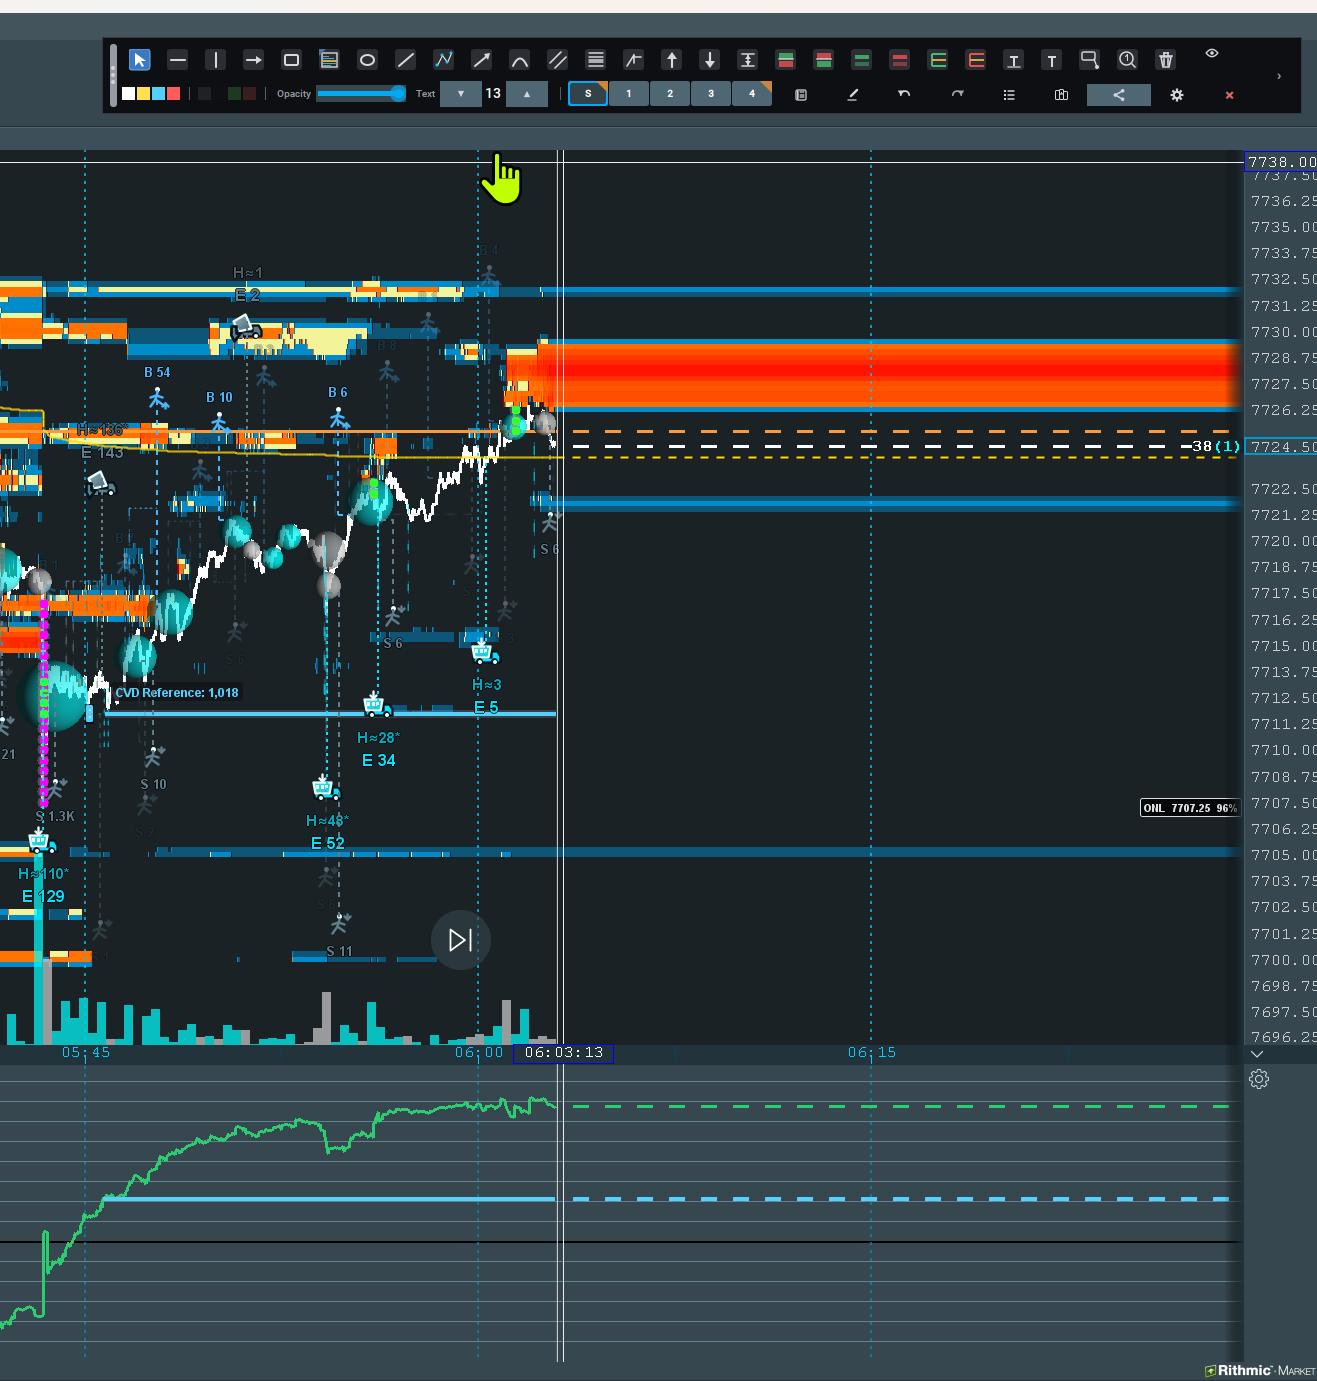
Two clicks box a time and price range. Every trade executed inside the box is counted, and the volume at each price draws as a bar growing from the box's left edge. The longest bar is the most-traded price.

A Range Volume Profile drawn on a live Bookmap heatmap: a teal box over the traded range, its volume histogram down the left edge, an mPOC label, and the orange stepped migration path showing where the most-traded price moved as the profile developed.
A Range Volume Profile on the chart, with its migration path
The center of it

Micro VPOC

The mPOC marks the box's most-traded price. Show it as a straight line, or as a migration path that steps through where acceptance moved as the profile developed.

The edges

Range High and Low

Each gets its own color, thickness and style, can extend to the right, and can carry a label.

Live

Follows price

Auto-extend keeps the right edge on the live price line. An R.V.P. cannot be placed past that line.

Double-click a box to open R.V.P. Appearance. Every change previews live before you commit it, and Cancel or Esc rolls back to what you started with. The counts use the market's executed trades, never your own fills.

Layers, and a list of everything on it.

Once you have drawn enough for it to be useful, the problem stops being drawing and starts being finding.

Everything on the chart

The objects list

Every drawing is a row you can find, edit, delete or mark to persist, tagged with the layer it belongs to.

Grouping

Layers

Group drawings, then show, hide or lock a whole layer at once. Drag layers into the order you want. A locked layer refuses, quietly and on purpose.

Across days

Bring forward

Filter by day, and carry a level forward from a previous session instead of drawing it again.

A journal for the day, kept beside the chart.

This is the part that makes ADT more than an annotation tool. It keeps one page per trading day, and the notes you take are tied to the chart you took them on.

As it happens

Quick Notes

A feed of timestamped entries, each stamped with the price at the moment you saved it, and carrying a bias chip: Long, Neutral or Short.

The wider view

Session Notes

A free-form area for the day, saved when the window loses focus, when it closes, and when you change day.

On the chart

Reference markers

Drop a marker the moment something happens and give it a note. Markers collect in time order, and clicking one jumps to it on the chart.

Tied together

Both directions

A marker with a note also appears as a linked journal entry. Editing the note updates the entry, and deleting either side cleans up after itself.

A day navigator moves between Prev day, Today and Next day, and past days are read-only history. A pencil button on the palette, or a hotkey, takes a note without leaving the chart.

One shared Room layer, live.

A Live Room relays shared drawings in real time. Other traders using ADT see the Room layer on the matching Bookmap chart; people without Bookmap can use a read-only web monitoring view. One person holds the pen at a time, so the room stays readable.

From a browser

No Bookmap required

People without Bookmap can join a read-only web monitoring view. It shows the Room drawing types its renderer supports over a delayed price backdrop. The backdrop uses 15-minute candles and requests the latest five days by default.

One at a time

The pen is passed

Participants ask for the pen and wait in a first-come queue. The host, or a moderator the host appoints, passes it over and can take it back.

Who is who

Four roles

Host, moderator, participant and web watcher. Moderators help run the room and manage the pen. Only the host appoints them.

Kept apart

The room is its own layer

What arrives from a room lands in a separate Shared Room layer beside your own work rather than mixed into it. Clearing the room wipes the room; your own drawings are untouched. A room holds up to 100 people.

Privacy

Nobody sees who else is there

Participants and watchers are anonymous to one another; only the host and appointed moderators see the roster. Everything travels through the relay. ADT never opens a peer-to-peer connection between traders.

Live Rooms ship with Advanced Drawing Tools. Hosting or joining on a Bookmap chart needs ADT; the read-only web view only needs a browser.

Walk back through the day, one step at a time.

A chart with everything on it at once is hard to explain and hard to learn from. Storyboard groups your drawings into steps and reveals them in order, so the chart tells the day the way it happened.

Group

Build steps from the drawings you have selected, name them, and reorder them.

Filter

Choose which layers take part, so an unrelated layer does not wander into the story.

Play

Back, Next, Show All and Exit, in their own small controller window.

Reuse

Save a story's structure as a template and use it again on the next session.

Remove is not Delete. Taking a drawing out of a step removes it from the story. It does not erase the drawing from your chart. The two controls are deliberately separate, and deleting always asks first.

Lines that draw themselves, at the same time every day.

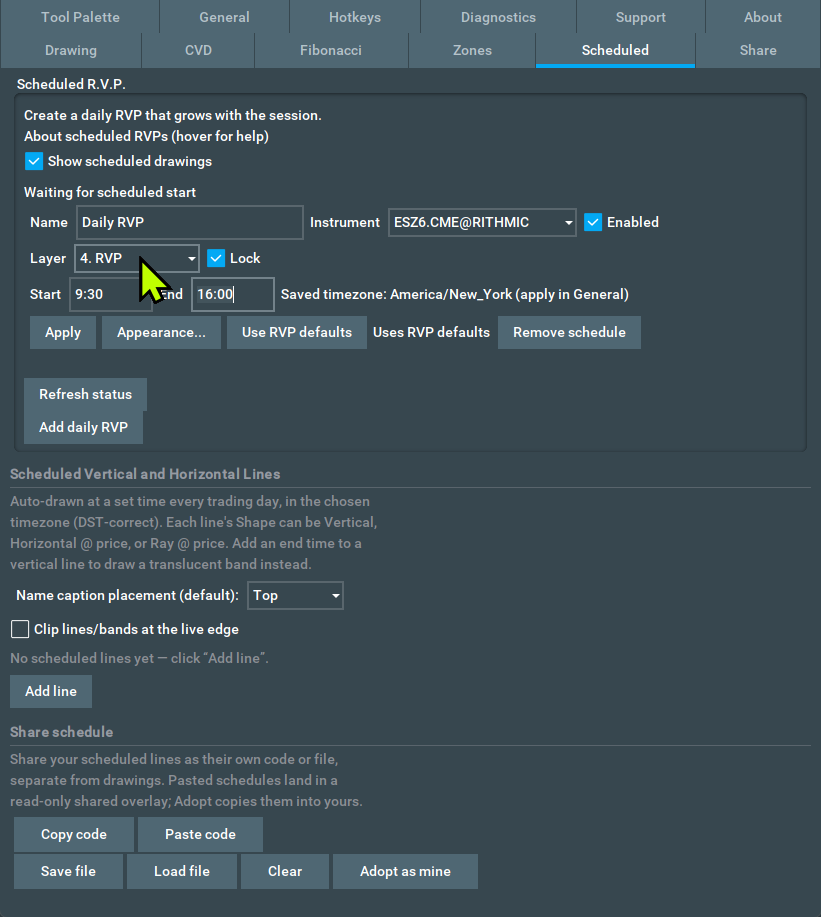
Levels and session boundaries you redraw every morning can be set once and left alone. Scheduled lines are drawn automatically at a set time each trading day, in the timezone you choose, and they are DST-correct.

In time

Vertical

A full-height line at the scheduled time. Give it an end time and it draws a translucent band instead.

At a price

Horizontal

A full-width level. Either capture the traded price as the scheduled time passes, or type a fixed price.

From then on

Ray

That price drawn from the scheduled time rightward to the live edge.

Each entry has its own time, its own look and its own name, and can break from the defaults where you need it to. Schedules share separately from drawings, and one someone sends you stays read-only until you adopt it.

Ten stamps you place all the time, one click away.

A tray of up to ten presets for the marks you make over and over. Each keeps its own look and its own slot, and the slot is a stable hotkey, so the preset in slot 3 is always the one slot 3 arms.

Arm, then place

Two deliberate actions, so a stamp never lands by accident. The preset disarms itself once placed.

Placed is placed

A stamp keeps the look it had when you placed it, so editing a preset later never rewrites marks already on the chart.

Fits where you put it

The tray switches between a row and a column, and between showing the wording and glyph-only.

Quick Annotations is part of Advanced mode.

Ten tabs, and sensible defaults behind them.

You can ignore all of it and just draw, or go in and set the defaults every new drawing starts from.

Drawing

The starting point for every tool, and how drawings behave at the live edge.

Fibonacci

Defaults for new fibs, and the level set.

Zones

Zone and bracket sizing, with separate heights for Buyers and Sellers.

Scheduled

Lines placed to a schedule, and how their captions sit.

Share

Opens the share panel, and holds the cloud opt-in.

Tool Palette

Layout, tool order, and which tools show.

General

How the add-on behaves overall, from interface mode through to backup and restore.

Hotkeys

Bind the actions you use. Nothing is bound until you bind it.

Diagnostics & About

Logging controls, and the license and disclaimer.

Timestamps follow whichever timezone you work in. Undo goes back 50 actions, and the trading day rolls at 18:00.

Hand someone your chart.

A marked-up chart travels as a code. Get share code copies one in a click, and the person on the other end pastes it in. There is a long offline code form, and a file option for Drive or Dropbox.

Cloud sharing is opt-in. The Allow SDES cloud setting is yours to turn on. Leave it off and sharing stays local. ADT never opens a direct peer-to-peer connection between traders.

On your chart in a couple of minutes.

There is no configuration to get through before you can draw something.

Install

Add ADT to Bookmap's add-ons and enable it on the chart you want it on.

Draw

The palette opens. Pick a tool, click the chart. That is the whole loop.

Keep it

Drawings save per instrument, per session date, in ADT's own folder. Nothing is written into Bookmap's files.

Your chart stays yours.

ADT collects no personal data. Settings, drawings, journal pages and its log all live in its own folder on your machine. Nothing leaves it unless you deliberately share a chart, and then only the drawing data you chose to send.

Coming to the Bookmap Marketplace.

Not yet listed. Advanced Drawing Tools is not on the Bookmap Marketplace yet. When the listing goes live this page will link straight to it. There is no download here in the meantime.

Read it before you buy it.

Both documents are free to read and cover the shipping build. Start with the quick start; the user guide is the reference you come back to.

Quick Start — 4 pages, 146 KB  ·  User Guide — 32 pages, 547 KB

Common questions

Does ADT place or modify trades?

No. It draws and annotates. It has no order-routing path.

Do people need Bookmap to watch my Live Room?

No. Traders with ADT see the Room layer on their Bookmap chart; people without Bookmap can use the read-only web monitoring view. Its price backdrop is delayed.

Can everyone in a room draw at once?

No, and that is deliberate. One person holds the pen. Participants ask for it and wait their turn, and the host or a moderator passes it over.

Will a room overwrite my own drawings?

No. Room drawings arrive in their own separate Shared Room layer. Clearing the room does not touch your own work.

Where are my drawings stored?

In ADT's own folder on your machine, one file per instrument per session date, alongside its settings, journal pages and log. It does not write into Bookmap's own files.

Do my drawings come back tomorrow?

Drawings save per session date. A drawing you want to keep across days is marked to persist, and a level from a previous session can be brought forward from the objects window.

What is the difference between Remove and Delete in Storyboard?

Remove takes a drawing out of a story step and leaves it on your chart. Delete erases the drawing, and always asks first.

Can I hide tools I never use?

Yes. All 26 drawing tools can be shown or hidden in Settings under Tool Palette, and reordered by dragging. Select and Delete are core controls and always stay.

Do I have to use layers and storyboards?

No. Essential mode gives you the tools and the object list and leaves the rest off. You can switch modes whenever you like.

Does the journal save automatically?

Yes. Quick Notes and Session Notes save on their own. Past days become read-only history.

Can I back up my setup?

Yes. Backup and restore is in Settings under General.

What support is included?

Email questions and bug reports — free. For a question, write to support@sdes.dev. For something that looks broken, use support@sdes.dev with the subject already set to a bug report. ADT keeps a log file in its own folder that you can attach. Replies aren't instant — expect a day or two — but every email gets a real answer.

Live screen-share setup help — paid. Book a 1-on-1 session when you want hands-on help rather than email.